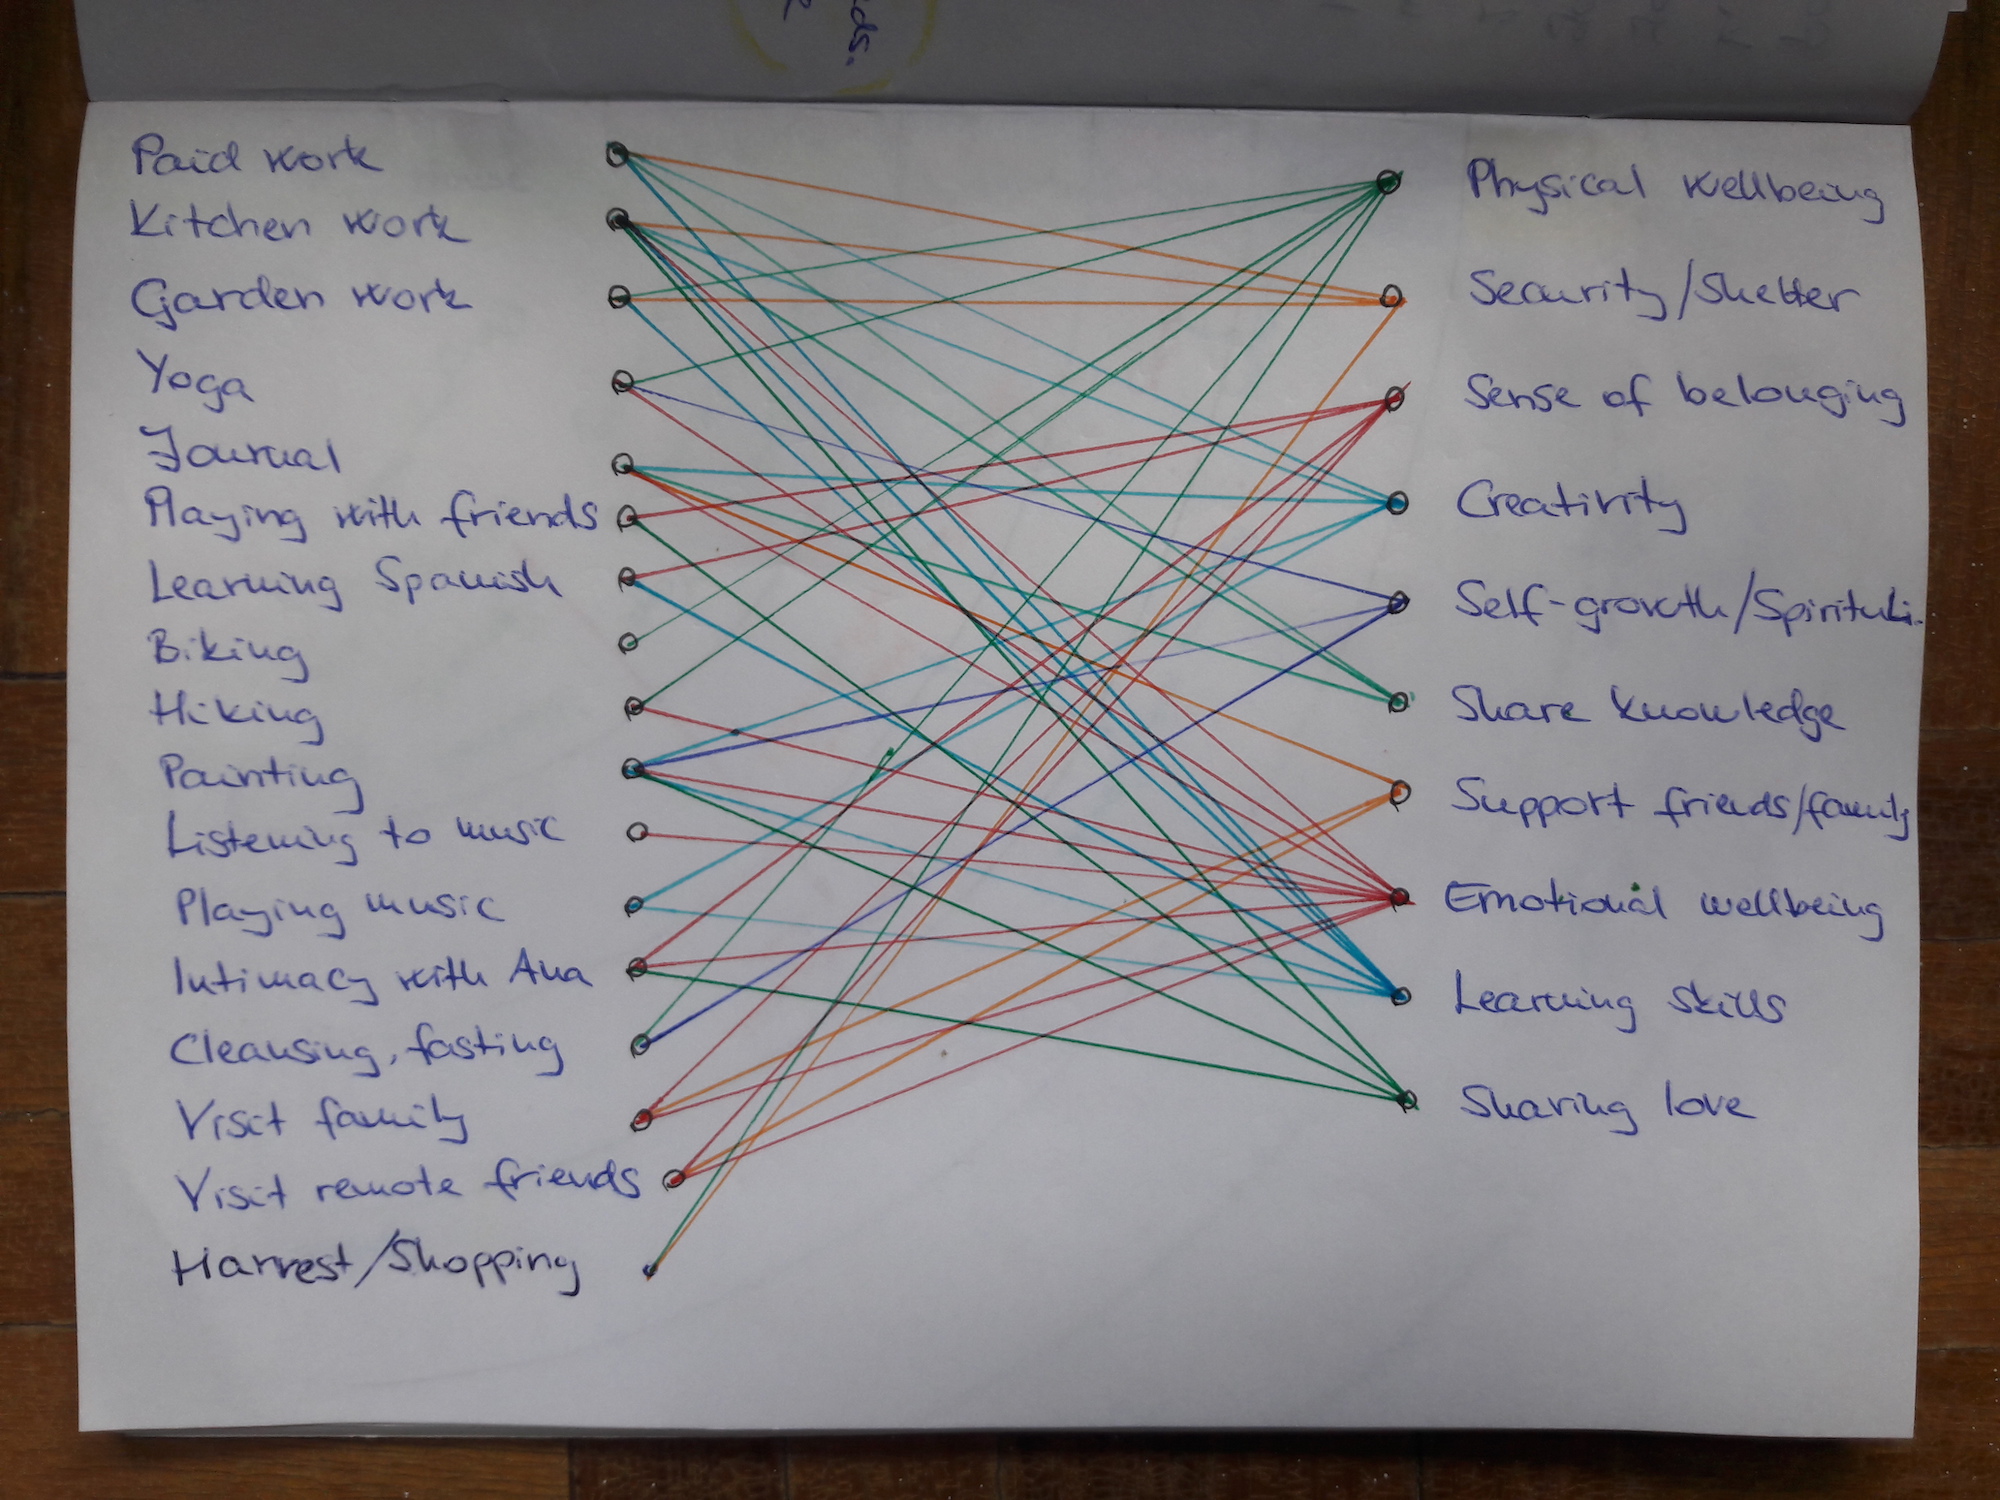
I utilized the zonal analysis from my permaculture toolbox to map out my key life activities based on their frequency and space requirements. I collected the activities with the help of Arno Peters' Elements x functions tool which was inspired by the Web of goals tool by Jacob Lund Fisker (Early Retirement Extreme) .
In the following charts I mapped out what I currently do. Another variant of this exercise is to create a version in which I explore where I would like to get to.
I used the zonal analysis to visualize the distance and frequency factors. Ideally, the further I go in space, the less frequently I should perform the activities. The color coding I chose reveals potential tension between the sectors. When two activities are connected with dotted lines, they refer to significantly different occurrences of the same activity.
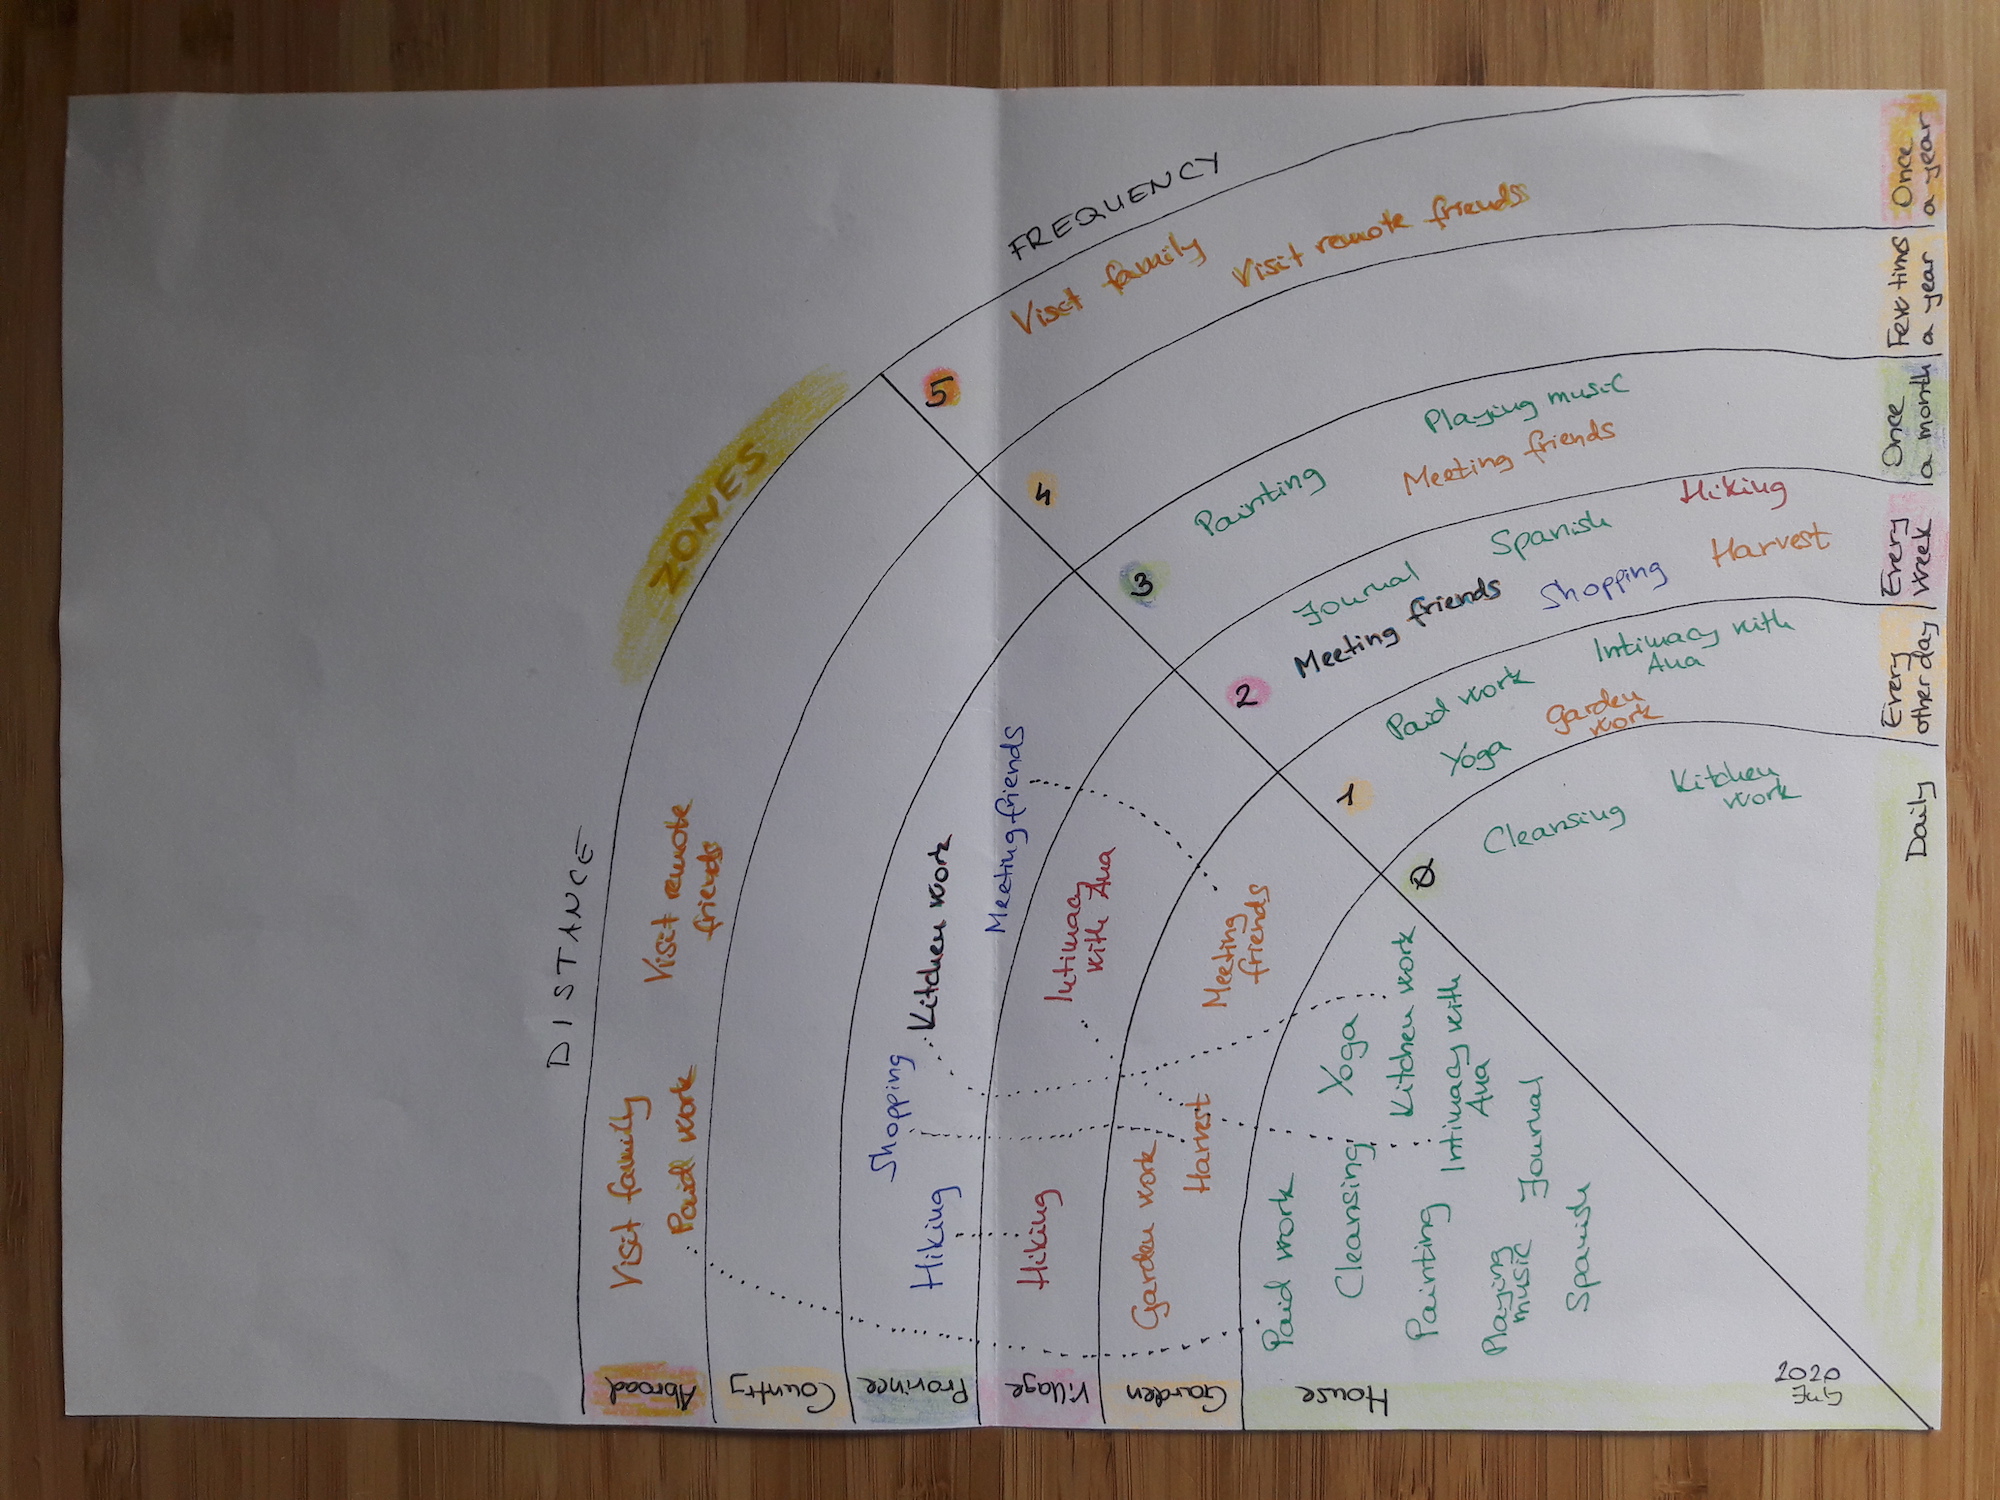
Here are a few examples to show case how to read the chart:
- I perform many activities in the house (zone 0). It’s more than what would be required based on their frequency. Could I benefit from doing any of these activities more often?
- Currently visiting family is in zone 5 in both sectors. The activity (i.e. traveling) requires lots of energy and therefore I perform it rarely. In my vision, I spend time with my family at least once a month (zone 3). This creates a tension because space-wise I’m required to go as far as zone 5. How can I travel less while seeing my family more often?
- Harvesting-shopping spans the garden (zone 1) and the province (zone 3). I do it once a week at the moment (zone 2). With more garden work (i.e. growing more food), I could move this element to zone 1-2 in both sectors.